How To Know If Someone Blocked You On iMessage? 5 Secret Hacks!
Apr 16, 2025

Apr 16, 2025

Apr 16, 2025

Apr 15, 2025

Apr 11, 2025

Apr 11, 2025

Apr 11, 2025

Apr 08, 2025

Mar 29, 2025
Sorry, but nothing matched your search "". Please try again with some different keywords.


What report shows the percent of site traffic that visited previously?
The question is one of the most common questions found in SEO tests. Furthermore, it mainly comes with four options. These are Sales performance report, frequency and recency report, new vs returning visitor report, and referrals report.
The answer to this question is: “New vs Returning” visitor report. This report allows you to analyze the usability of your website. On the other hand, you will be able to check the percentage of visitors that are returning to your business website. It shows the efficiency of your website. In this article, we will discuss the reports that are used to track visitors, especially the new vs returning visitor report in Google Analytics.

If you run a website, it is crucial for you to know the number of times your viewers are returning to your website. This is because it is a crucial metric that you must track to check the growth of your website. If you want to check the percentage of traffic on your website, you have previously visited the site, and you will need to check the ‘New vs Returning visitor’ report on Google Analytics.
Once your track this metric on Google Analytics, you will get useful insights related you your website. Furthermore, you will be able to find out the efficiency of your marketing efforts, as well as your target audience’s loyalty to your business and their engagement.
Read More: What Is Not Considered A “Source” In Google Analytics By Default?
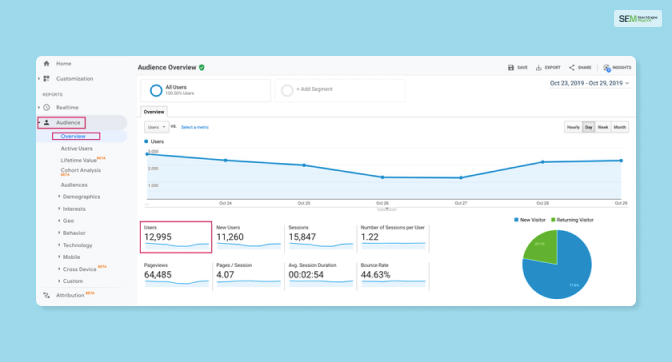
The following are the steps that you will need to follow if you want to access the ‘New vs Returning visitor’ report:
Step 1: Open a browser, and sign in to your Google Analytics account with your username and password.
Step 2: Click on the website that you want to view the traffic for.
Step 3: On the left-hand menu section, click on the “Audience” option.
Step 4: Under the “Audience” subsection, click on the “Behavior” option.
Step 5: Under the “Behavior” option, you will see types of reports. Click on the “New vs Returning.”
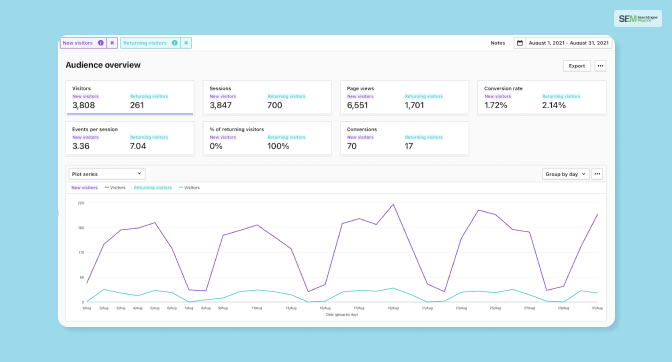
The New vs Returning visitor report will help to get an idea of the number of new visitors on your website and the number of returning visitors by comparing them with each other. Once you select a date range in the section of the report, you will get a comparison of the percentage of new visitors vs returning visitors.
On this report section, at the top of the page, you will find a date range selector. You can make use of this tool to view the date as per a particular range of time. Apart from that, if you use the default setting, you can see a comparison of the data for the last thirty days.
Moreover, it is also important for you to note that this returning visitor report tool will only help you to get a count of the visitors who have already visited your site and accepted the website cookies on their browsers. Once a visitor to your website has allowed cookies or is using a different browser or device, Google will identify that visitor as a new visitor, although the visitor has already visited your site before.
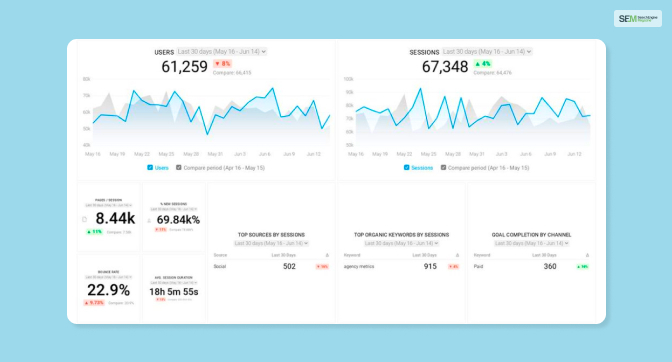
The following are the major advantages that you will benefit from once you start using the New vs Returning visitor report to track your returning visitors:
Apart from the New vs Returning visitor report, there are also a few other reports that you will get in Google Analytics, which you can use to check the online behavior of your returning visitors. These reports are described below:
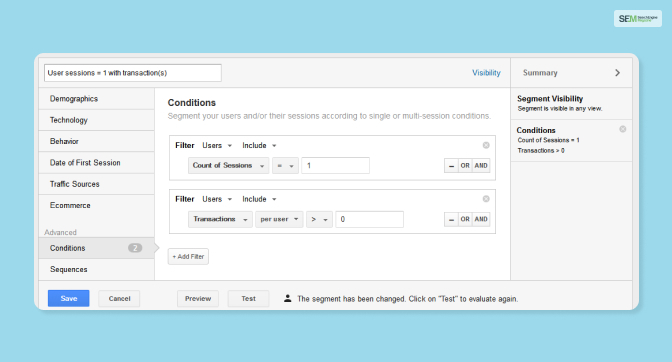
If you want to know the number of times your visitors returned to your website within a particular period of time, then you will need to use the “Frequency and Recency” report. Furthermore, you will also get a better idea of the length spent by the visitors between their visits to your website. Hence, you will get to know how frequently your target viewers visit your website and what you can do to improve this frequency.
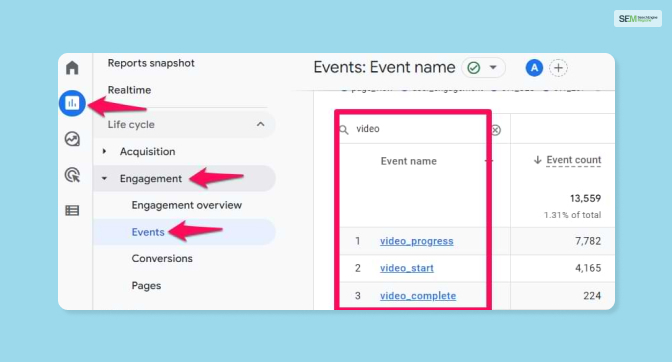
The “Engagement Report” on Google Analytics will give you a better idea of how many average numbers of pages your viewers viewed and what is the average length of time your viewers spent on the site. You can get data for both your new and returning visitors. Hence, you will be able to measure the effectiveness of the efforts of your marketing and will also be able to find better opportunities.
Read More: When Will Google Analytics Be Unable To Identify Sessions From The Same User By Default?
The answer to the question, “What report shows the percent of site traffic that visited previously?” is the New vs Returning visitor report. With the help of the report, you will be able to get a comparison of the percentage of new visitors on your website to the percentage of returning visitors. Apart from that, there are also other reports like Frequency & Regency Report and Engagement Report, which you can effectively use to check or track the viewers on your website. Do you know more about any other advantages of these reports? Share with us in the comment section below.
Read Also:
Inspired by The Social Network, Soumava loves to find ways to make small businesses successful – he spends most of his time analyzing case studies of successful small businesses. With 5+ years of experience in flourishing with a small MarTech company, he knows countless tricks that work in favor of small businesses. His keen interest in finance is what fuels his passion for giving the best advice for small business operations. He loves to invest his time familiarizing himself with the latest business trends and brainstorming ways to apply them. From handling customer feedback to making the right business decisions, you’ll find all the answers with him!
View all Posts
How To Know If Someone Blocked You On iMessag...
Apr 16, 2025
7 Website Design Mistakes That Are Hurting Yo...
Apr 16, 2025
Programmable Dynamic SEO for Location-Based P...
Apr 15, 2025
Google Boba Game: How To Play This Fun Game B...
Apr 11, 2025
Which Is The Best Video Search Engine Of 2025...
Apr 11, 2025

